


.avif)

SOC Performance and Growth
Record alert volumes, expanding client base, and continued operational efficiency through automation and tuning.
Client Growth and Sector Expansion
In FY25, the Triskele Labs Security Operations Centre (SOC) processed approximately 263,000 alerts — a significant increase from nearly 185,000 in FY24. This growth aligns with a 69% year-on-year rise in active Managed Detection and Response (MDR) clients across fully managed and DFIR monitoring services.
The SOC’s reach expanded across several new sectors, including construction, education and logistics, while maintaining strong representation in established industries such as finance and insurance, health and community care, professional and business services, retail, FMCG and consumer services, not-for-profit, and industrial sectors.
Efficiency at Scale
Despite a sharp increase in total alerts, the average volume per client remained steady at around 222 alerts per month. This stability underscores the effectiveness of Triskele Labs’ ongoing investments in correlation tuning, enrichment pipelines, and suppression logic.
When isolating manually triaged cases, excluding those managed by in-house automation, the figure reduced further to an average of 181 alerts per client per month, reflecting the success of automation initiatives in improving efficiency and analyst focus.
Context in the National Threat Landscape
The Australian Cyber Security Centre (ACSC) reported more than 87,000 cybercrime incidents in FY2023–24, equating to one report every six minutes. Across the broader industry, SOC teams in Australia and New Zealand were found to process roughly 4,450 alerts per day on average.
Within this context, Triskele Labs’ alert volumes remain proportionate to national trends, indicating that the SOC’s scale and throughput are well aligned with Australia’s evolving cyber threat environment.
Detection and Response Performance
Rapid detection, targeted response, and continued refinement of alert quality underpin SOC efficiency and resilience.
Detection Efficacy
The Triskele Labs SOC continues to demonstrate strong internal detection capability, identifying and acting on critical incidents within a median of 7.3 minutes. This performance reflects significant investment in tooling, automation, and analyst workflows that enable rapid visibility and containment across client environments.
For context, Mandiant’s M-Trends 2023 report indicates that only 37% of breaches are typically detected internally across most industries, with the majority identified by external parties. Triskele Labs’ consistently low Mean Time to Detect (MTTD) highlights the maturity of its detection engineering and triage models, particularly across higher-risk sectors such as finance, healthcare, and professional services.
Alert Quality and False Positives
Alert fidelity remains a strategic focus. Internal analysis indicates that approximately 70% of alerts processed do not translate into actionable security incidents, a proportion consistent with broader industry experience.
Through targeted rule tuning, suppression logic, and contextual enrichment, the SOC continues to reduce noise and direct analyst attention toward meaningful alerts. Client-specific suppression rules and enhanced routing within the case management platform have further improved accuracy and workflow efficiency.
These measures have maintained analyst throughput and helped mitigate operational fatigue, even as telemetry volumes increase. Continuous tuning remains central to sustaining detection accuracy and response speed.
Mean Time to Detect (MTTD)
Median MTTD for critical incidents improved to 7.3 minutes in FY24–25, down from 9.1 minutes in FY22–23. High-priority incidents averaged between 18–20 minutes, remaining well within benchmarked industry performance.
This improvement reflects Triskele Labs’ ongoing investment in detection engineering, threat model refinement, and enriched telemetry pipelines that accelerate context delivery to analysts.
Mean Time to Respond (MTTR)
Median MTTR for critical incidents fell to 3.6 minutes, improving on 4.7 minutes the previous year. This metric captures the period between detection and containment action, such as host isolation or user disablement, reflecting the speed and precision of containment workflows.
For high-priority cases, MTTR rose modestly to 5.6 minutes from 3.5 minutes. This change is attributed to triage sequencing, with critical incidents prioritised first and high cases requiring deeper investigation. It also reflects success in tuning and enrichment, where non-actionable alerts are increasingly filtered before analyst engagement.
Mean Time to Conclusion (MTTC)
MTTC, the sum of detection and response time, remained well within internal thresholds of ≤60 minutes for critical and ≤120 minutes for high incidents.
FY24: 7.29 +3.60 = 10.89 minutes
FY25: 7.27 +3.72 = 10.99 minutes
High MTTC
FY24: 19.73 +3.56 = 23.29 minutes
FY25: 19.38 +5.62 = 25.00 minutes
With internal MTTC thresholds of ≤60 minutes for critical and ≤120 minutes for high, Triskele’s SOC remains well under target across both categories.
These figures demonstrate consistent containment speed and reinforce the operational maturity of Triskele Labs’ SOC model — balancing automation, detection precision, and human response.
Cases by Source
SIEM remains the foundation of SOC visibility, enabling comprehensive threat detection beyond the endpoint.
Overview
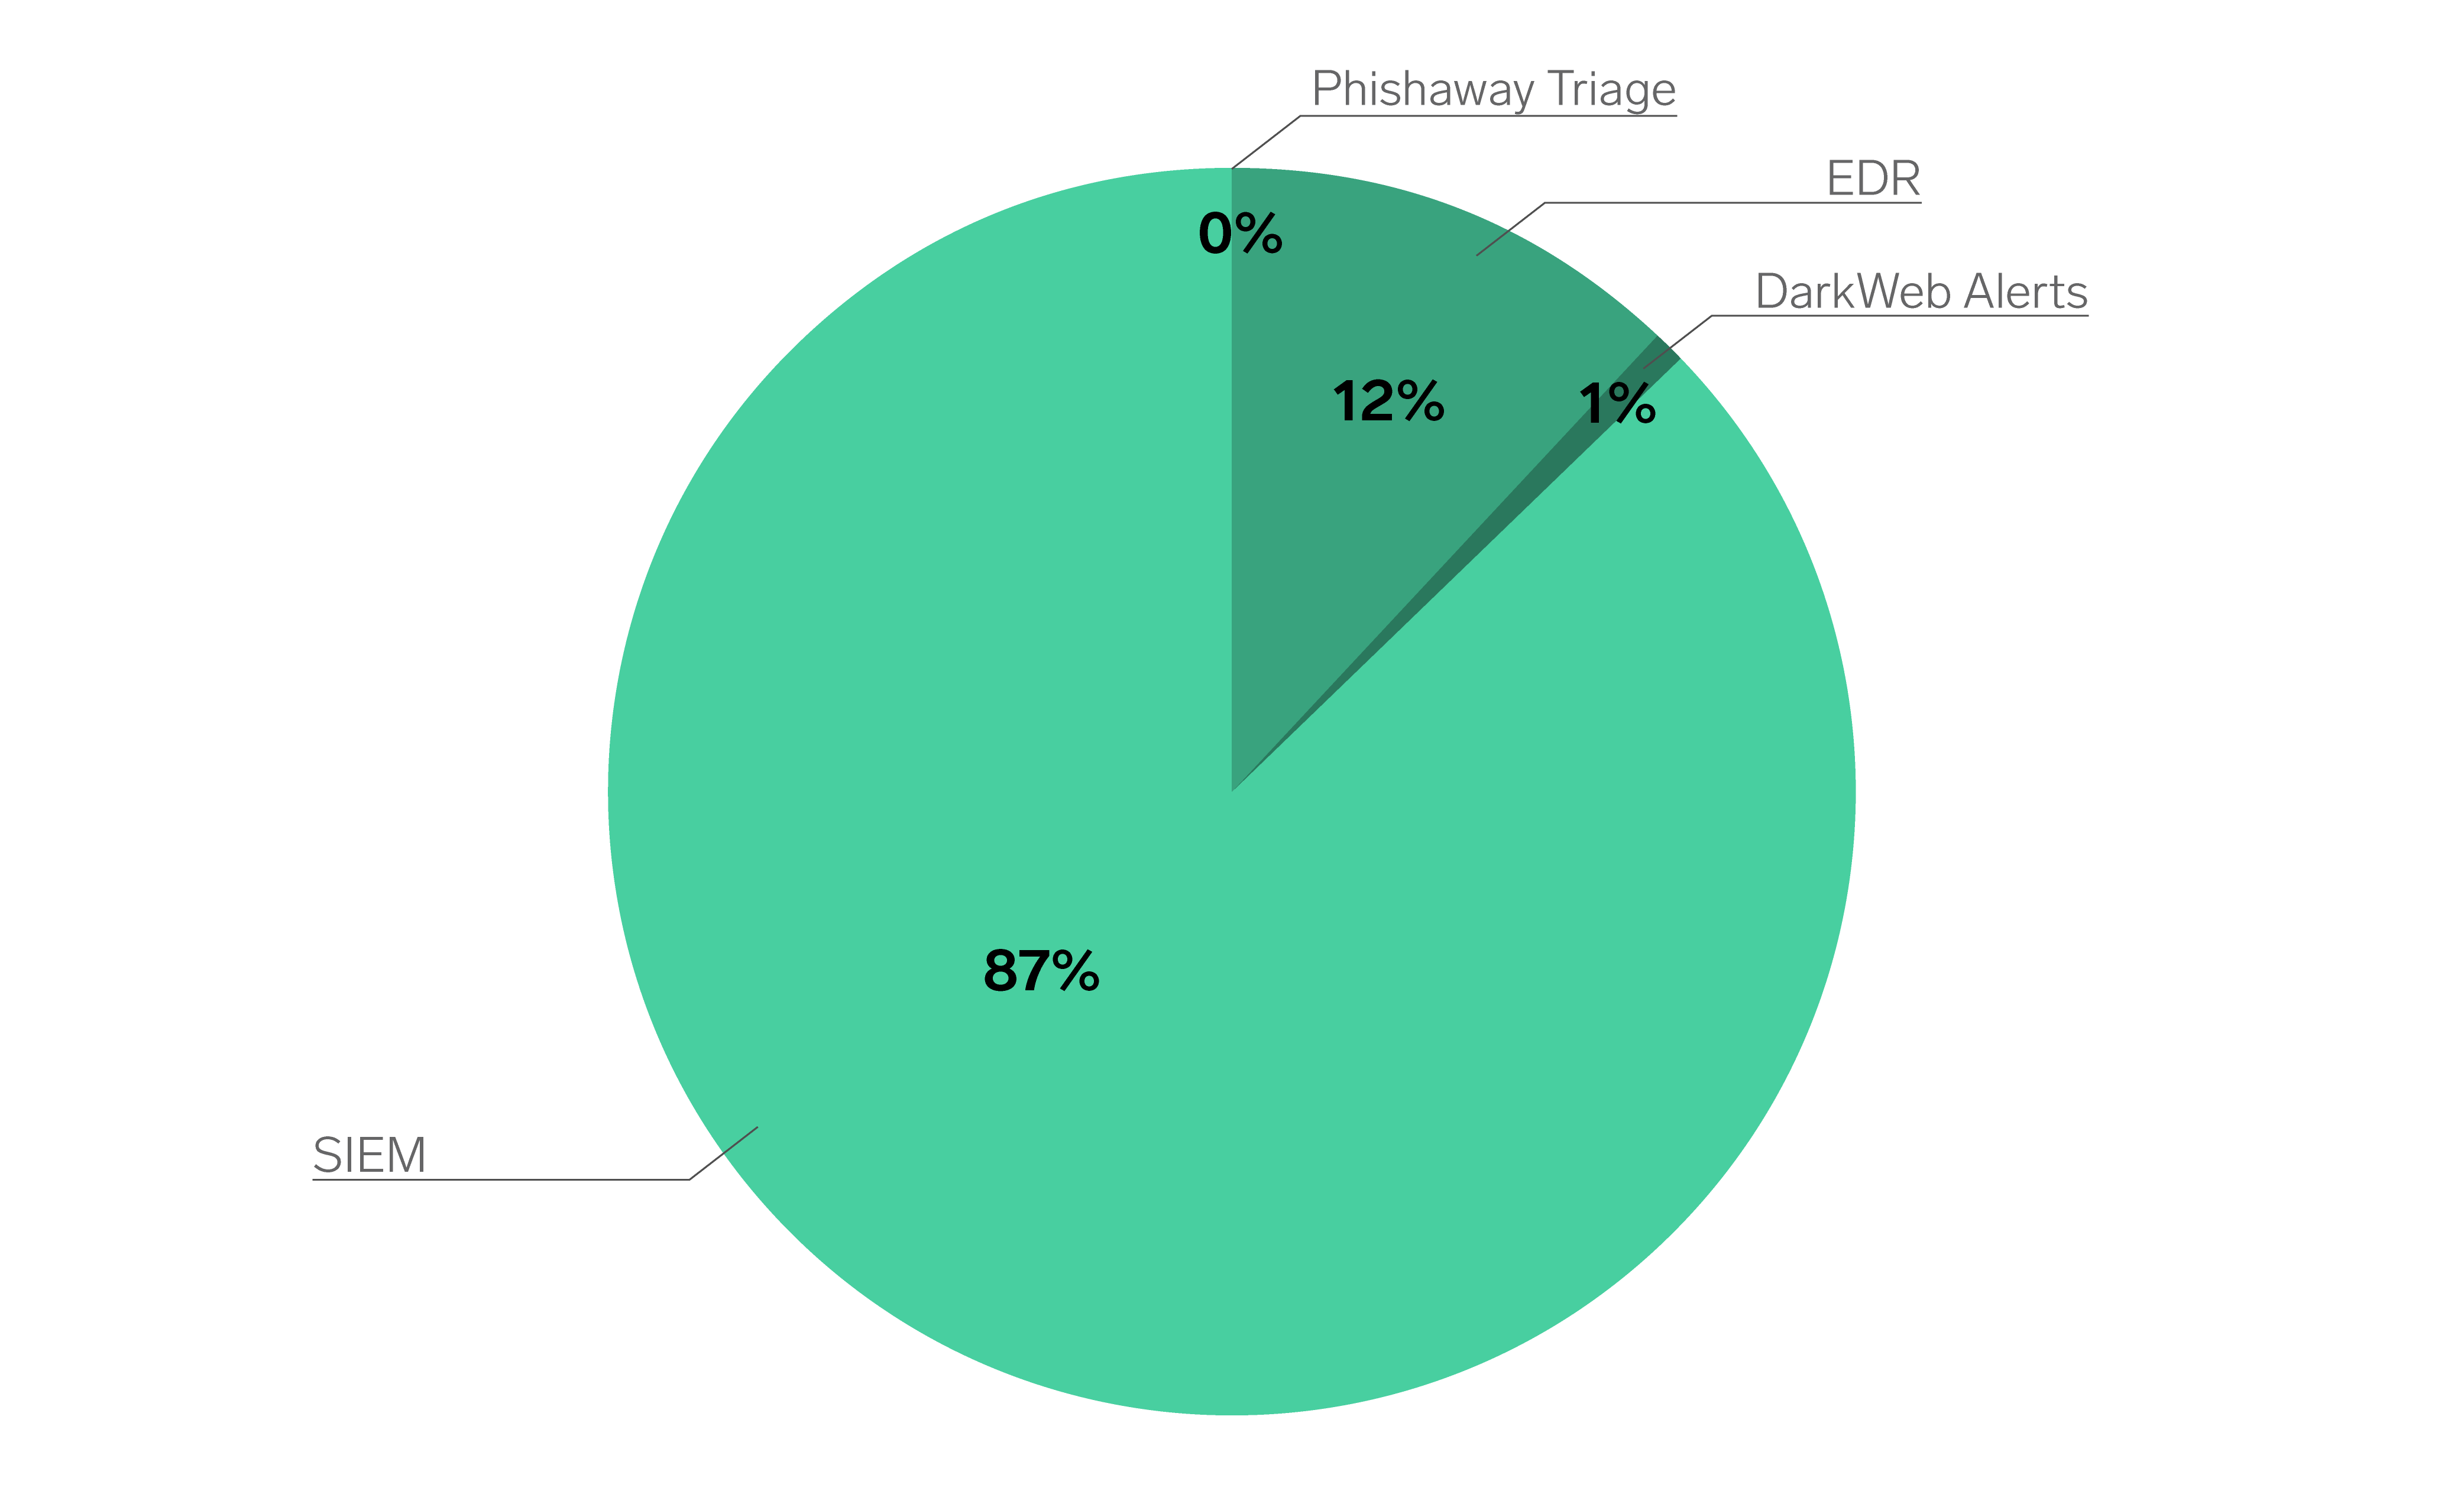
Analysis of FY25 case distribution shows that 87% of alerts originated from the Security Information and Event Management (SIEM) platform, 12% from Endpoint Detection and Response (EDR)tools, and 1% from Dark Web monitoring. Phishing triage contributed a negligible volume during the period.
These figures reinforce that while EDR solutions play an important role in endpoint-level visibility, SIEM remains the backbone of effective Security Operations Centre (SOC) and Managed Detection and Response (MDR) capabilities.
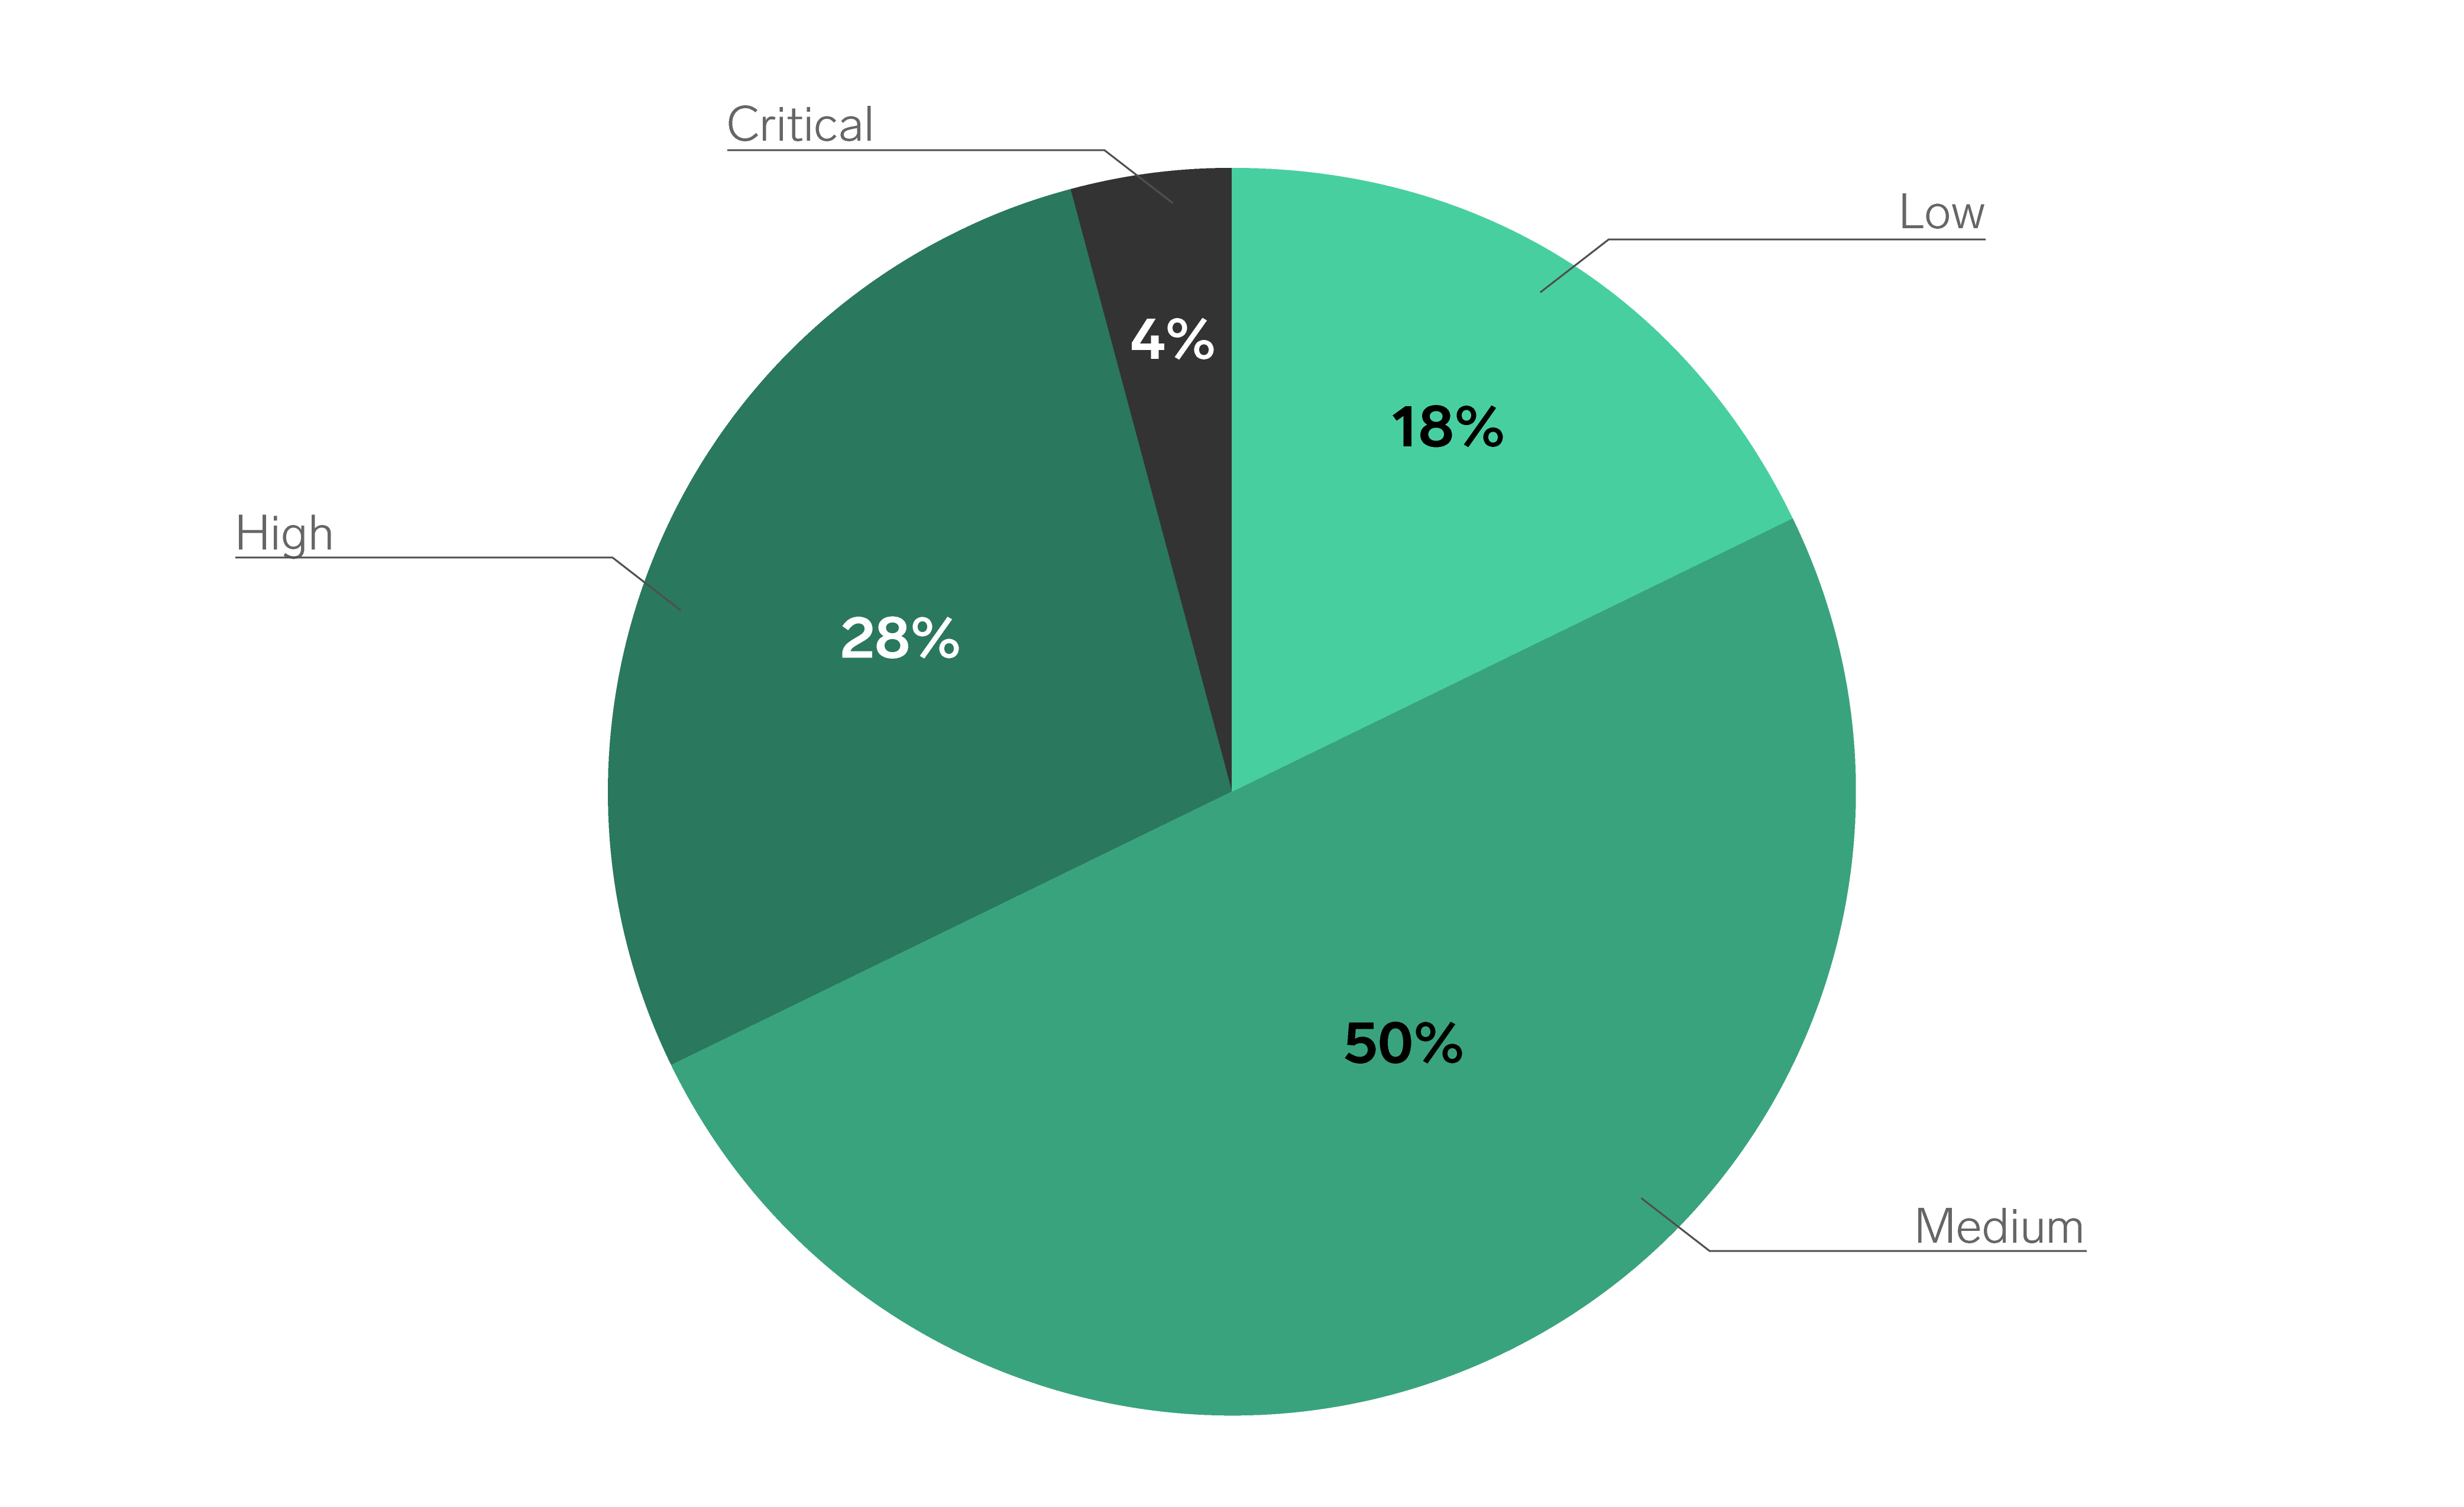
Case priority breakdown
Strategic Importance of SIEM
Modern cyber threats rarely remain confined to a single endpoint. Attackers increasingly exploit credentials, move laterally through networks, and target cloud and SaaS infrastructure. In this landscape, an endpoint-only view is insufficient.
A well-tuned SIEM aggregates and correlates telemetry from across the environment, including identity providers, network devices, servers, cloud applications, and security controls. This unified perspective enables analysts to detect cross-domain activity and identify high-impact threats that would otherwise go unnoticed in isolated systems.
Complementary Role of EDR
EDR platforms remain an essential component of Triskele Labs’ detection ecosystem, providing deep forensic insight and rapid containment capability at the device level. However, their scope is inherently limited. Without correlation against broader environmental data through the SIEM, incidents that span multiple vectors, such as lateral movement or privilege escalation, may evade detection.
The strong ratio of SIEM-driven detections highlights the continued value of a correlated, context-aware defence model that integrates endpoint, network, and cloud telemetry into a single operational picture.
Interesting Statistics
Alert volumes continue to grow while detection accuracy and true positive rates improve year-on-year.
Overview of Alert Volumes
Total alerts processed by the SOC increased slightly to 247,922 in FY25, maintaining stability following a major uplift in FY24. The majority of cases were categorised as Medium and Low severity, reflecting a mature and proactive monitoring posture rather than a reactive one.
High-severity alerts accounted for approximately 16%of total cases, while Critical alerts continued to represent a small but strategically important proportion at around 2%. This profile aligns with expected trends in mature SOC environments, where strong preventive controls reduce the frequency of high-impact incidents.
Ticketing and Escalation Trends
The total number of ticketed cases rose modestly to 10,442, representing 4.2% of total alerts. While this percentage is lower than FY24’s 5.6%, it reflects improvements in automation, correlation, and suppression logic that are successfully filtering non-actionable alerts before analyst intervention.
Ticketing rates for Critical incidents remained high at 16%, consistent with operational prioritisation policies, while Medium and Low cases saw a proportional decline due to enhanced rule tuning and enrichment processes. This indicates that the SOC is increasingly focused on high-value, actionable events rather than volume-driven escalations.
Determination Accuracy and Quality
Accuracy metrics show continued improvement in detection quality. The proportion of True Positive determinations rose to 40.08%,up from 34.35% in FY24 and 17.84% two years prior, a clear indicator of ongoing refinement in correlation rules and enrichment accuracy.
Meanwhile, False Positive rates decreased to 59.52%, continuing a downward trajectory year-on-year. This reduction highlights the effectiveness of continuous tuning initiatives and the integration of automation in early-stage triage. Indeterminate outcomes dropped to just 0.39%, underscoring improved clarity in alert disposition and case resolution.
Key Takeaways
- Stabilised alert growth following last year’s expansion suggests sustained operational maturity.
- Improved detection accuracy reflects investment in tuning, enrichment, and automation.
- Reduced false positives have directly enhanced analyst efficiency and reduced fatigue.
- Critical and high alerts remain tightly managed, demonstrating effective prioritisation and triage discipline.
Top 10 Cases
Initial access and authentication anomalies remain dominant vectors inclient environments.
Overview
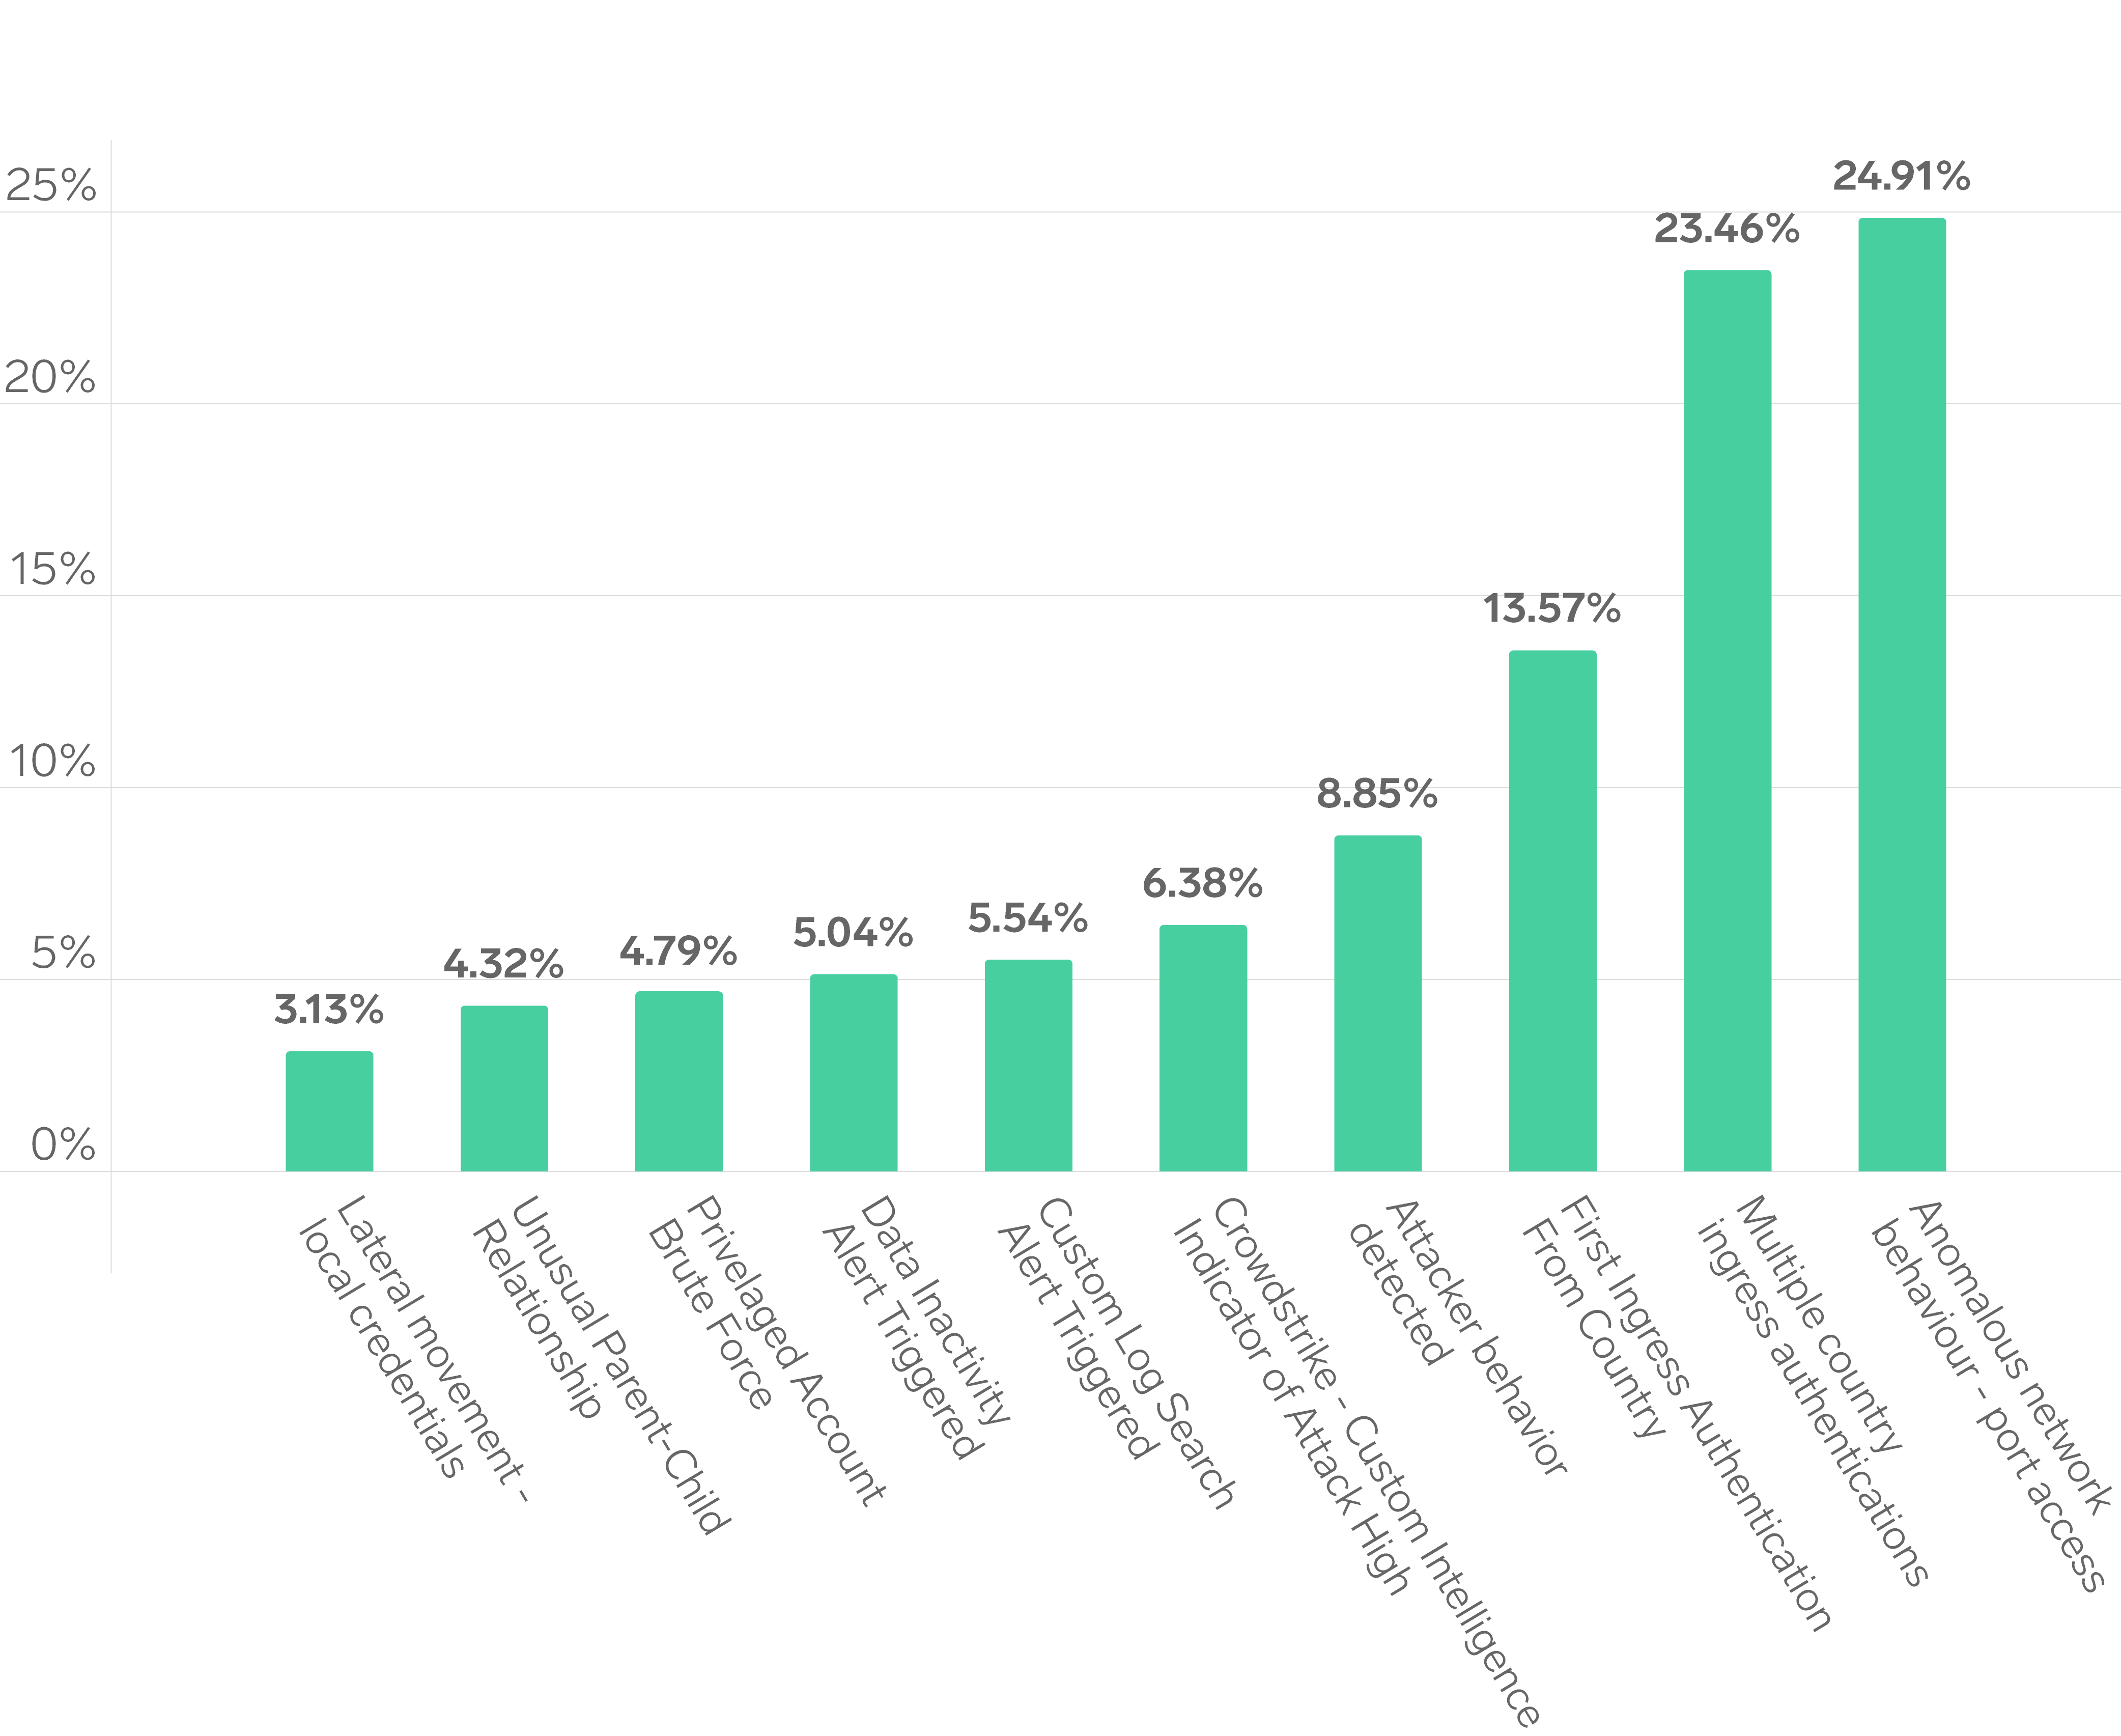
Analysis of the top 10 case types across all clients shows that initial access and credential-based anomalies continue to represent the most significant threat categories. The two leading detections — Anomalous Network Behaviour (PortAccess) and Multiple Country IngressAuthentications, together accounted for nearly half of all observed cases.
These findings reinforce that adversaries are frequently exploiting authentication pathways and misconfigured access controls to establish footholds within client networks. The prominence of “First Ingress Authentication from Country” and “Attacker Behaviour Detected” further highlights the sophistication of lateral movement and reconnaissance techniques observed throughout the year.
Strategic Insight
This pattern underscores that while endpoint and network defences remain effective at identifying known signatures and behavioural anomalies, identity-focused attacks are now a primary risk vector. Stronger control frameworks around multi-factor authentication, geolocation policies, and privileged account monitoring continue to be essential in mitigating this risk.
The persistence of Lateral Movement – Local Credentials and Brute Force Activity within the top ten reinforces the need for ongoing investment in detection engineering and identity telemetry correlation across clients.
Cases by Vertical
Finance, Health, and Critical Infrastructure sectors remain the most targeted industries under SOC monitoring.
Overview
Case distribution by industry shows the Finance and Insurance sector continues to record the highest case volume, representing approximately 20% of all monitored activity. This is followed by Health and Community Care (11.7%), Technology and Engineering (10.6%), and Professional and Business Services (9.1%).
These sectors consistently appear among the most targeted across Australia due to their data sensitivity, operational criticality, and interconnected digital ecosystems. Finance and Health in particular face sustained targeting from both financially motivated and state-aligned actors.
The Industrial and Resources and Consumer Services sectors also contributed notable case volumes, reflecting growing attacker interest in operational technology (OT) and supply-chain environments.
Strategic Insight
This distribution aligns with national threat intelligence trends, where adversaries increasingly prioritise sectors that combine high-value data with complex, decentralised IT and OT environments. Continuous monitoring, sector-specific detection content, and adaptive enrichment logic remain vital in addressing this evolving exposure.

SOC Performance and Growth
Record alert volumes, expanding client base, and continued operational efficiency through automation and tuning.
Client Growth and Sector Expansion
In FY25, the Triskele Labs Security Operations Centre (SOC) processed approximately 263,000 alerts — a significant increase from nearly 185,000 in FY24. This growth aligns with a 69% year-on-year rise in active Managed Detection and Response (MDR) clients across fully managed and DFIR monitoring services.
The SOC’s reach expanded across several new sectors, including construction, education and logistics, while maintaining strong representation in established industries such as finance and insurance, health and community care, professional and business services, retail, FMCG and consumer services, not-for-profit, and industrial sectors.
Efficiency at Scale
Despite a sharp increase in total alerts, the average volume per client remained steady at around 222 alerts per month. This stability underscores the effectiveness of Triskele Labs’ ongoing investments in correlation tuning, enrichment pipelines, and suppression logic.
When isolating manually triaged cases, excluding those managed by in-house automation, the figure reduced further to an average of 181 alerts per client per month, reflecting the success of automation initiatives in improving efficiency and analyst focus.
Context in the National Threat Landscape
The Australian Cyber Security Centre (ACSC) reported more than 87,000 cybercrime incidents in FY2023–24, equating to one report every six minutes. Across the broader industry, SOC teams in Australia and New Zealand were found to process roughly 4,450 alerts per day on average.
Within this context, Triskele Labs’ alert volumes remain proportionate to national trends, indicating that the SOC’s scale and throughput are well aligned with Australia’s evolving cyber threat environment.
Detection and Response Performance
Rapid detection, targeted response, and continued refinement of alert quality underpin SOC efficiency and resilience.
Detection Efficacy
The Triskele Labs SOC continues to demonstrate strong internal detection capability, identifying and acting on critical incidents within a median of 7.3 minutes. This performance reflects significant investment in tooling, automation, and analyst workflows that enable rapid visibility and containment across client environments.
For context, Mandiant’s M-Trends 2023 report indicates that only 37% of breaches are typically detected internally across most industries, with the majority identified by external parties. Triskele Labs’ consistently low Mean Time to Detect (MTTD) highlights the maturity of its detection engineering and triage models, particularly across higher-risk sectors such as finance, healthcare, and professional services.
Alert Quality and False Positives
Alert fidelity remains a strategic focus. Internal analysis indicates that approximately 70% of alerts processed do not translate into actionable security incidents, a proportion consistent with broader industry experience.
Through targeted rule tuning, suppression logic, and contextual enrichment, the SOC continues to reduce noise and direct analyst attention toward meaningful alerts. Client-specific suppression rules and enhanced routing within the case management platform have further improved accuracy and workflow efficiency.
These measures have maintained analyst throughput and helped mitigate operational fatigue, even as telemetry volumes increase. Continuous tuning remains central to sustaining detection accuracy and response speed.
Mean Time to Detect (MTTD)
Median MTTD for critical incidents improved to 7.3 minutes in FY24–25, down from 9.1 minutes in FY22–23. High-priority incidents averaged between 18–20 minutes, remaining well within benchmarked industry performance.
This improvement reflects Triskele Labs’ ongoing investment in detection engineering, threat model refinement, and enriched telemetry pipelines that accelerate context delivery to analysts.
Mean Time to Respond (MTTR)
Median MTTR for critical incidents fell to 3.6 minutes, improving on 4.7 minutes the previous year. This metric captures the period between detection and containment action, such as host isolation or user disablement, reflecting the speed and precision of containment workflows.
For high-priority cases, MTTR rose modestly to 5.6 minutes from 3.5 minutes. This change is attributed to triage sequencing, with critical incidents prioritised first and high cases requiring deeper investigation. It also reflects success in tuning and enrichment, where non-actionable alerts are increasingly filtered before analyst engagement.
Mean Time to Conclusion (MTTC)
MTTC, the sum of detection and response time, remained well within internal thresholds of ≤60 minutes for critical and ≤120 minutes for high incidents.
FY24: 7.29 +3.60 = 10.89 minutes
FY25: 7.27 +3.72 = 10.99 minutes
High MTTC
FY24: 19.73 +3.56 = 23.29 minutes
FY25: 19.38 +5.62 = 25.00 minutes
With internal MTTC thresholds of ≤60 minutes for critical and ≤120 minutes for high, Triskele’s SOC remains well under target across both categories.
These figures demonstrate consistent containment speed and reinforce the operational maturity of Triskele Labs’ SOC model — balancing automation, detection precision, and human response.
Cases by Source
SIEM remains the foundation of SOC visibility, enabling comprehensive threat detection beyond the endpoint.
Overview
Analysis of FY25 case distribution shows that 87% of alerts originated from the Security Information and Event Management (SIEM) platform, 12% from Endpoint Detection and Response (EDR)tools, and 1% from Dark Web monitoring. Phishing triage contributed a negligible volume during the period.
These figures reinforce that while EDR solutions play an important role in endpoint-level visibility, SIEM remains the backbone of effective Security Operations Centre (SOC) and Managed Detection and Response (MDR) capabilities.
Case priority breakdown
Strategic Importance of SIEM
Modern cyber threats rarely remain confined to a single endpoint. Attackers increasingly exploit credentials, move laterally through networks, and target cloud and SaaS infrastructure. In this landscape, an endpoint-only view is insufficient.
A well-tuned SIEM aggregates and correlates telemetry from across the environment, including identity providers, network devices, servers, cloud applications, and security controls. This unified perspective enables analysts to detect cross-domain activity and identify high-impact threats that would otherwise go unnoticed in isolated systems.
Complementary Role of EDR
EDR platforms remain an essential component of Triskele Labs’ detection ecosystem, providing deep forensic insight and rapid containment capability at the device level. However, their scope is inherently limited. Without correlation against broader environmental data through the SIEM, incidents that span multiple vectors, such as lateral movement or privilege escalation, may evade detection.
The strong ratio of SIEM-driven detections highlights the continued value of a correlated, context-aware defence model that integrates endpoint, network, and cloud telemetry into a single operational picture.
Interesting Statistics
Alert volumes continue to grow while detection accuracy and true positive rates improve year-on-year.
Overview of Alert Volumes
Total alerts processed by the SOC increased slightly to 247,922 in FY25, maintaining stability following a major uplift in FY24. The majority of cases were categorised as Medium and Low severity, reflecting a mature and proactive monitoring posture rather than a reactive one.
High-severity alerts accounted for approximately 16%of total cases, while Critical alerts continued to represent a small but strategically important proportion at around 2%. This profile aligns with expected trends in mature SOC environments, where strong preventive controls reduce the frequency of high-impact incidents.
Ticketing and Escalation Trends
The total number of ticketed cases rose modestly to 10,442, representing 4.2% of total alerts. While this percentage is lower than FY24’s 5.6%, it reflects improvements in automation, correlation, and suppression logic that are successfully filtering non-actionable alerts before analyst intervention.
Ticketing rates for Critical incidents remained high at 16%, consistent with operational prioritisation policies, while Medium and Low cases saw a proportional decline due to enhanced rule tuning and enrichment processes. This indicates that the SOC is increasingly focused on high-value, actionable events rather than volume-driven escalations.
Determination Accuracy and Quality
Accuracy metrics show continued improvement in detection quality. The proportion of True Positive determinations rose to 40.08%,up from 34.35% in FY24 and 17.84% two years prior, a clear indicator of ongoing refinement in correlation rules and enrichment accuracy.
Meanwhile, False Positive rates decreased to 59.52%, continuing a downward trajectory year-on-year. This reduction highlights the effectiveness of continuous tuning initiatives and the integration of automation in early-stage triage. Indeterminate outcomes dropped to just 0.39%, underscoring improved clarity in alert disposition and case resolution.
Key Takeaways
- Stabilised alert growth following last year’s expansion suggests sustained operational maturity.
- Improved detection accuracy reflects investment in tuning, enrichment, and automation.
- Reduced false positives have directly enhanced analyst efficiency and reduced fatigue.
- Critical and high alerts remain tightly managed, demonstrating effective prioritisation and triage discipline.
Top 10 Cases
Initial access and authentication anomalies remain dominant vectors inclient environments.
Overview
Analysis of the top 10 case types across all clients shows that initial access and credential-based anomalies continue to represent the most significant threat categories. The two leading detections — Anomalous Network Behaviour (PortAccess) and Multiple Country IngressAuthentications, together accounted for nearly half of all observed cases.
These findings reinforce that adversaries are frequently exploiting authentication pathways and misconfigured access controls to establish footholds within client networks. The prominence of “First Ingress Authentication from Country” and “Attacker Behaviour Detected” further highlights the sophistication of lateral movement and reconnaissance techniques observed throughout the year.
Strategic Insight
This pattern underscores that while endpoint and network defences remain effective at identifying known signatures and behavioural anomalies, identity-focused attacks are now a primary risk vector. Stronger control frameworks around multi-factor authentication, geolocation policies, and privileged account monitoring continue to be essential in mitigating this risk.
The persistence of Lateral Movement – Local Credentials and Brute Force Activity within the top ten reinforces the need for ongoing investment in detection engineering and identity telemetry correlation across clients.
Cases by Vertical
Finance, Health, and Critical Infrastructure sectors remain the most targeted industries under SOC monitoring.
Overview
Case distribution by industry shows the Finance and Insurance sector continues to record the highest case volume, representing approximately 20% of all monitored activity. This is followed by Health and Community Care (11.7%), Technology and Engineering (10.6%), and Professional and Business Services (9.1%).
These sectors consistently appear among the most targeted across Australia due to their data sensitivity, operational criticality, and interconnected digital ecosystems. Finance and Health in particular face sustained targeting from both financially motivated and state-aligned actors.
The Industrial and Resources and Consumer Services sectors also contributed notable case volumes, reflecting growing attacker interest in operational technology (OT) and supply-chain environments.
Strategic Insight
This distribution aligns with national threat intelligence trends, where adversaries increasingly prioritise sectors that combine high-value data with complex, decentralised IT and OT environments. Continuous monitoring, sector-specific detection content, and adaptive enrichment logic remain vital in addressing this evolving exposure.


